IFEEL-Interpretable Feature Extraction of Electricity Loads
![]()
- A python package for Interpretable Feature Extraction of Electricity Loads (IFEEL).
- IFEEL has a similar pronunciation to the Eiffel Tower 🗼 so you will find two “Eiffel” electricity towers in the IFEEL logo.
- Description of IFEEL can be found on GitHub 🔗 (Recommended, no image loading issue) or PyPI 🔗
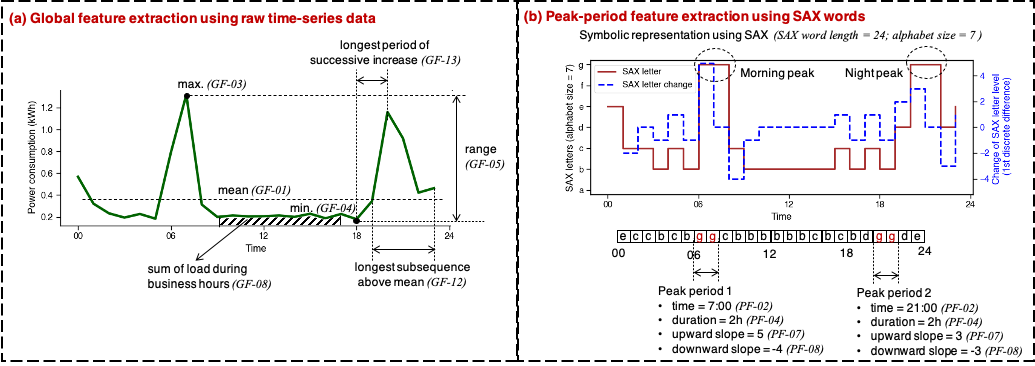
📌 Illustration
⚙️ Installation
You can use pip to easily install IFEEL with:
pip install ifeel
More info about pip can be found
here .
🤖 Developer info
-
Package title: Interpretable Feature Extraction of Electricity Load (IFEEL)
-
Authors: Maomao Hu, Dongjiao Ge, David Wallom
-
Organization: Oxford e-Research Center, Department of Engineering Science, University of Oxford
-
Contact info: maomaohu@nus.edu.sg
-
Development time: Oct 2020
-
Acknowledgement: This work was financially supported by the UK Engineering and Physical Sciences Research Council (EPSRC) under grant (EP/S030131/1) of AMIDINE. We also would like to thank the help from Bruce Stephen, Jethro Browell, Rory Telford, Stuart Galloway, and Ciaran Gilbert from the University of Strathclyde.
💬 About IFEEL
(1) This Python package (i.e., IFEEL) aims to help energy data analysts to readily extract interpretable features of daily electricity profiles from a physical perspective. The extracted features can be applied for further feature-based machine learning purposes, including feature-based PCA, clustering, classification, and regression.
(2) Two PY files (.py) are included in the IFEEL package, including ifeel_transformation.py and ifeel_extraction.py.
(3) Two types of features, including 13 global features (GFs) and 8 peak-period features (PFs), can be extracted by using this package. Detailed description of all features can be found in Ref [1] or the Demo file in the installed IFEEL package.
(4) GFs are extracted based on raw time-series data, while PFs are extracted based on symbolic representation of time series data. GFs and PFs can be obtained by using IFEEL.ifeel_extraction.feature_global and IFEEL.ifeel_extraction.feature_peak_period, respectively.
(5) For fast peak-period feature extraction, Symbolic Aggregate approXimation (SAX) representation is first used to transform the time-series numerical patterns into alphabetical words. The feature transformation process is performed by calling IFEEL.ifeel_transformation.feature_transformation. More details about SAX approach can be found in Ref [2] and Ref [3].
🔈 Notes
(1) To successfully run the IFEEL, the following Python data analysis libraries need to be installed in advance: Numpy, Scipy, and Pandas.
(2) A Demo can be found in the installed IFEEL package or here. Three datasets at different time intervals can be downloaded here, and tested in the Demo.
(3) The Demo has been tested on Python 3.7.7.
📚 References
[1] Hu M, Ge D, Telford R, Stephen B, Wallom D. Classification and characterization of intra-day load curves of PV and non-PV households using interpretable feature extraction and feature-based clustering. Sustainable Cities and Society. 2021;75:103380.
[2] Lin J, Keogh E, Wei L, Lonardi S. Experiencing SAX: a novel symbolic representation of time series. Data Mining and Knowledge Discovery. 2007;15:107-44.
[3] Keogh E, Lin J, Fu A. HOT SAX: efficiently finding the most unusual time series subsequence. 5TH IEEE International Conference on Data Mining (ICDM'05). 2005. p8.